Stylizing plots using matplotlib
Updated:
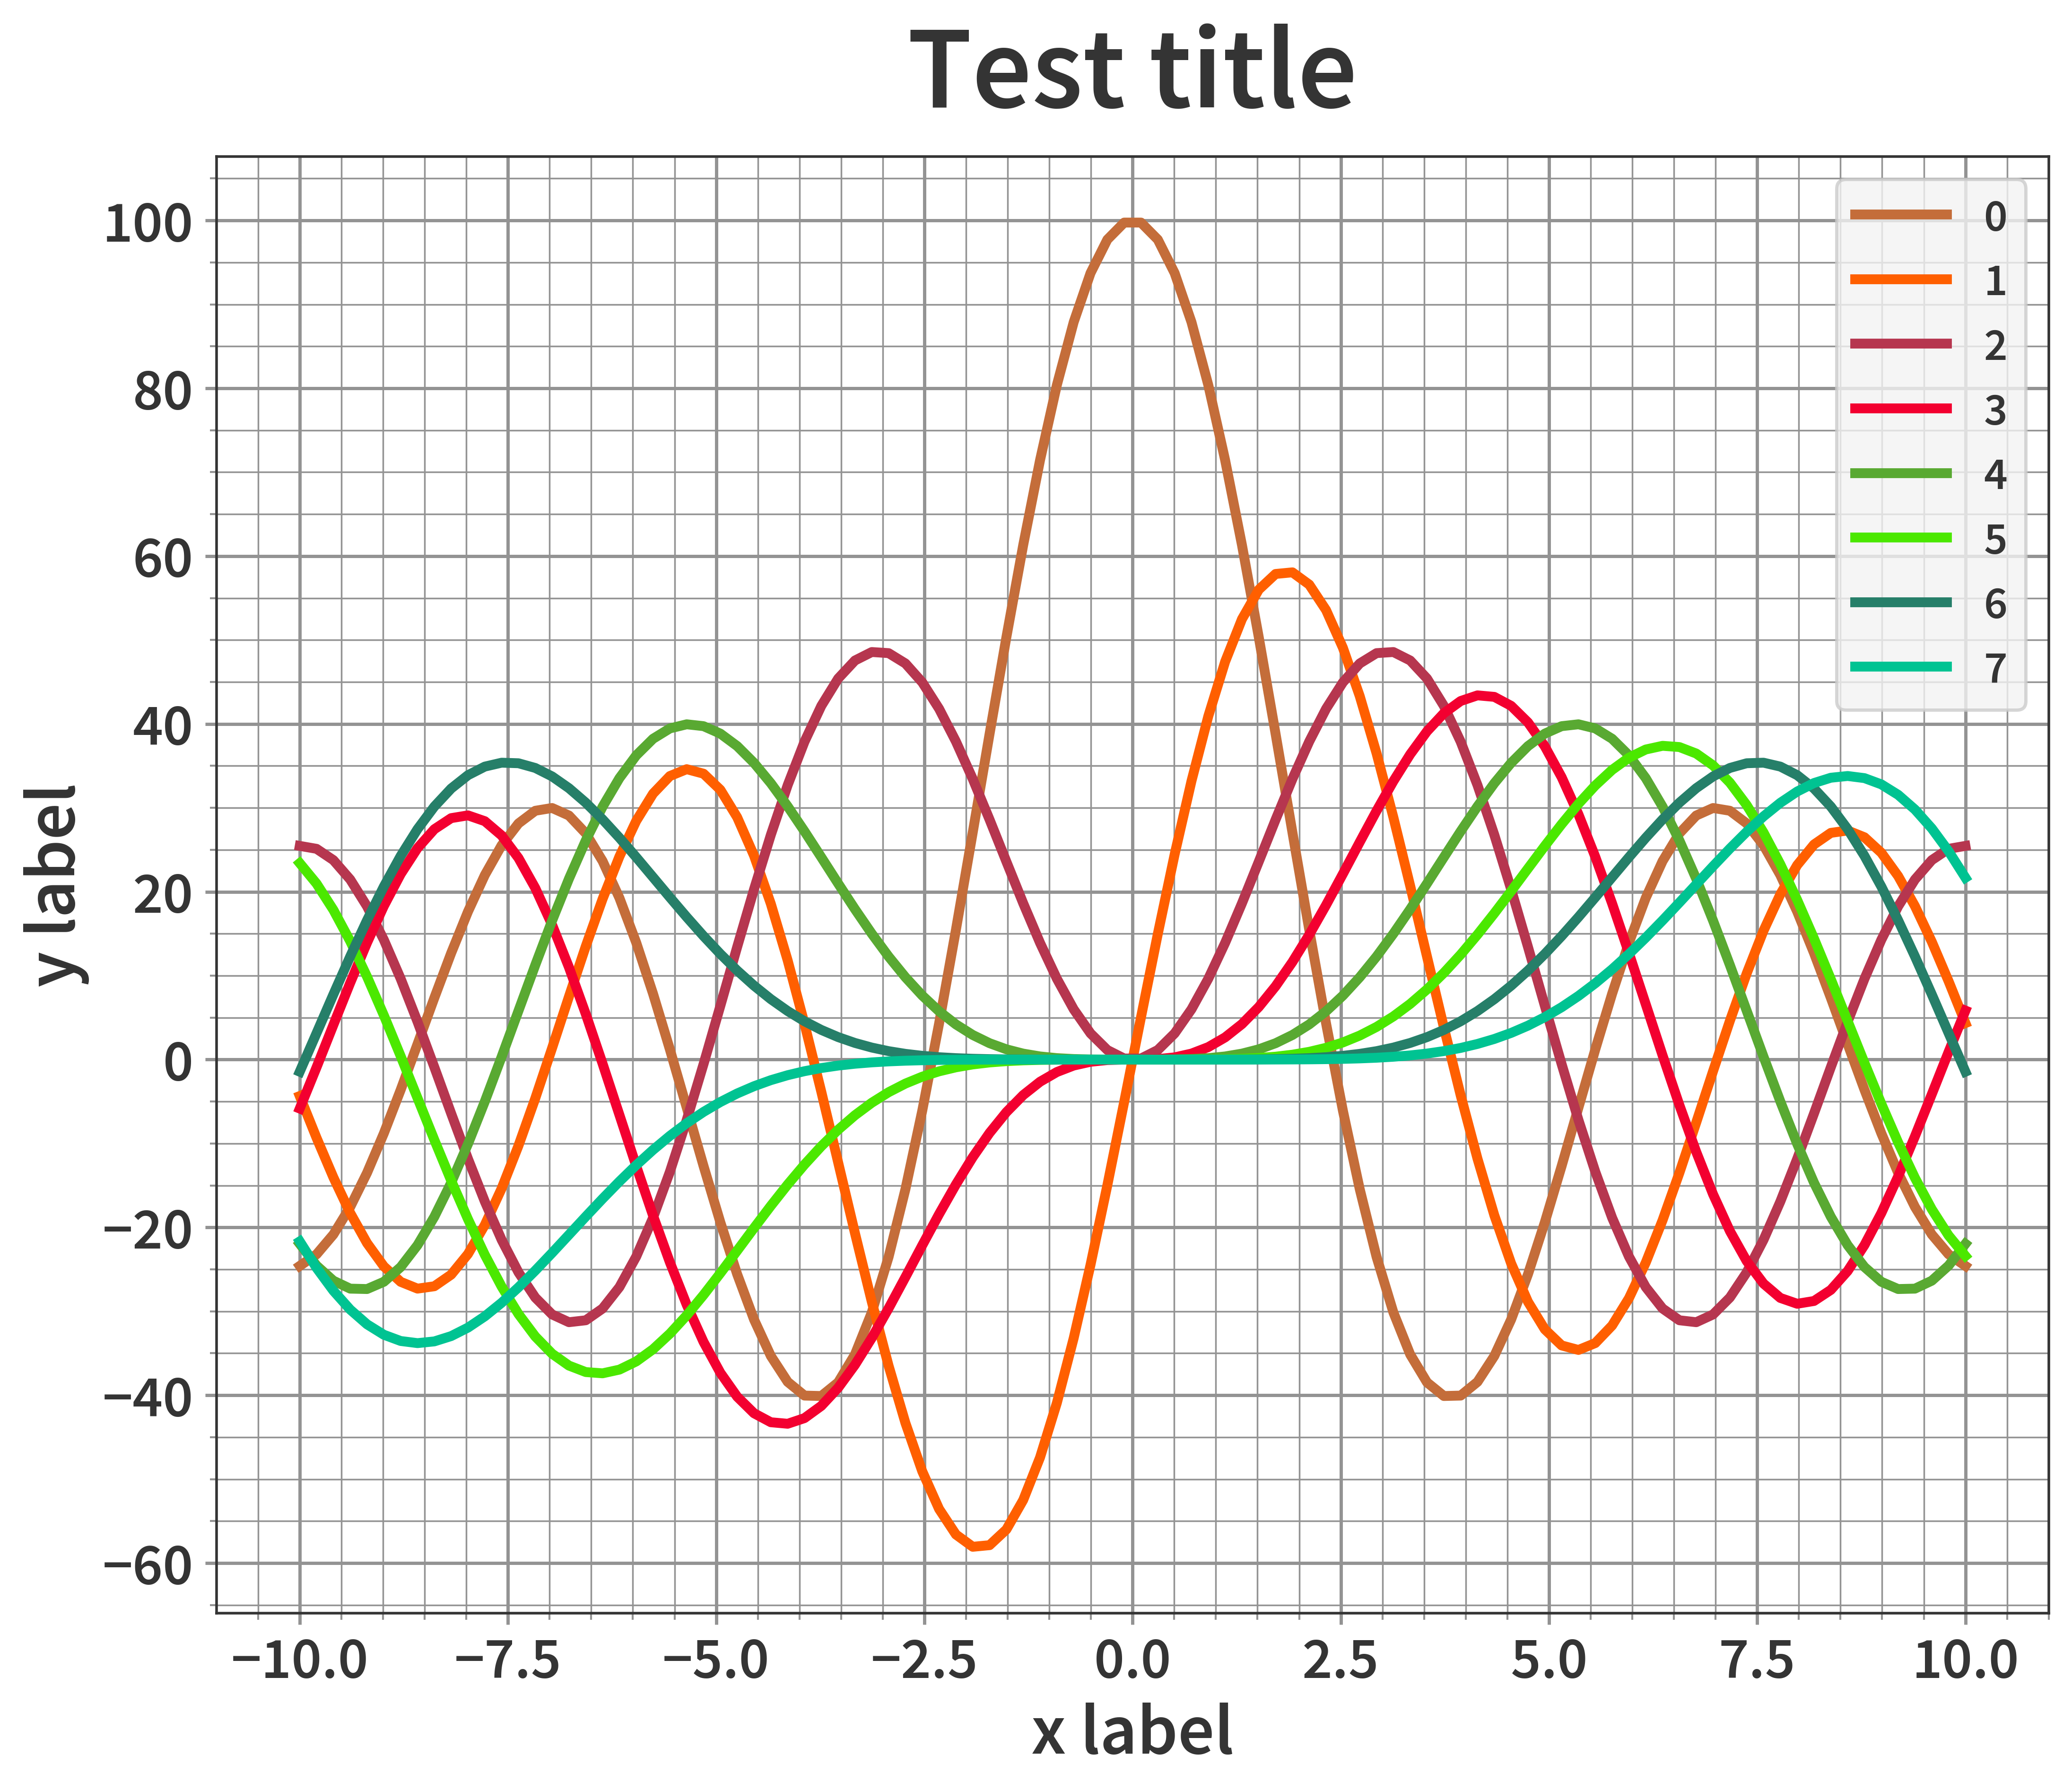
I use the following code to set up the matplotlib plots.
1
2
3
4
5
6
7
8
9
10
11
12
13
14
15
16
17
18
19
20
21
22
23
24
25
26
27
28
29
30
31
32
33
34
35
36
37
38
39
40
41
42
43
44
45
46
47
48
49
50
51
52
53
54
55
56
57
58
59
60
61
62
63
64
from cycler import cycler
import numpy as np
import matplotlib.pyplot as plt
from scipy.special import jv

%matplotlib inline
%config InlineBackend.figure_format = 'svg'

font_color = '#343434'
plot_color = '#F3F3F3'
grid_color = '#939393'
grid_width = 1
rc_light = {'mathtext.fontset' : 'stix',
    'font.family'      : 'Source Sans Pro',
    'font.weight'      : 400,
    'xtick.labelsize'  : 18,
    'ytick.labelsize'  : 18,
    'axes.labelsize'   : 22,
    'axes.labelweight' : 400,
    'axes.titlesize'   : 36,
    'axes.titleweight' : 400,
    'axes.titlepad'    : 15,
    'legend.fontsize'  : 14,
    'lines.linewidth'  : 3,
    'axes.facecolor'   : plot_color,
    'axes.edgecolor'   : font_color,
    'figure.facecolor' : plot_color,
    'text.color'       : font_color,
    'axes.labelcolor'  : font_color,
    'xtick.labelcolor' : font_color,
    'ytick.labelcolor' : font_color,
    'xtick.color'      : grid_color,
    'ytick.color'      : grid_color,
    'ytick.major.width': grid_width,
    'xtick.major.width': grid_width,
    'grid.color'       : grid_color,
    'grid.linewidth'   : grid_width,
    'patch.linewidth'  : grid_width,
    'axes.prop_cycle'  : cycler(color=['#C46D3A', '#FF5F00',
                                       '#B6364F', '#F30030',
                                       '#59A932', '#4BE800',
                                       '#267F69', '#00C392'])
     }
plt.rcParams.update(rc_light)

x = np.linspace(-10, 10, 100)
N = 8

fig, ax = plt.subplots(1, 1)
fig.set_figheight(8) #set height of the entire figure
fig.set_figwidth(10) #set width of the entire figure

for i in range(0, N):
    J = jv(i, x)
    ax.plot(x, 100*J, label = f'{i}')

ax.set_title('Test title')
ax.set_xlabel('x label')
ax.set_ylabel('y label')
ax.grid(visible = True, which = 'major')
ax.grid(visible = True, which = 'minor', linestyle = '-', lw = 1)
ax.minorticks_on()
ax.legend()
fig.savefig("test_plot.png", dpi = 500, bbox_inches='tight', transparent = True)

In order to use scientific formatting along with controlling the number of decimals
1
2
3
4
5
6
7
8
9
10
11
12
13

from matplotlib import ticker
#The class is necessary in order to control both number of decimals as well as scientific notation
class ScalarFormatterClass(ticker.ScalarFormatter):
    def _set_format(self):
        self.format = "%.2f"

formatter = ScalarFormatterClass(useMathText=True)
formatter.set_scientific(True)
formatter.set_powerlimits((0,0))
ax.yaxis.set_major_formatter(formatter)
#For some reason, the scientific notation is set to the same color as the grid. This is changed using:
ax.yaxis.get_offset_text().set_color(font_color)
