Imaging diffraction grating
Updated:
These Friday afternoon experiment show how different transmission spectra behave when reflected off a grating. The black body is set to 500 ºC and pointed towards a reflective grating with 100 lines/mm and 27º blaze angle. The reflected light is then oriented such that most of it makes it onto the sensor. It is however evident that longer wavelengths (above 11.5 µm) are not imaged using this method. No further optics have been added to the setup, meaning that it is just the regular germanium lens, which focus the incoming light onto the sensor. Unfortunately the angle between the black body and the grating was not recorded. Below, you can see two videos scrolling through the layers of a hyperspectral data cube showing how the different wavelengths are transmitted at different mirror separations. The title above each image refer to the mirror separation and not the wavelength. This is also only a crop of the original data cube showing only the rows in which the reflected light can be seen.
500 ºC black body
Transmission of 10 µm bandpass filter
Now we are only going to look at a single row - in this case it is row 50 (but it does not really matter which one). We can then construct a new image (2D) where the rows represent the mirror separations, and the columns represent wavelengths. At this point we only know the mirror separation and not the correlation between column index and wavelengths. To solve this, we are going to look at a couple of transmission filters.
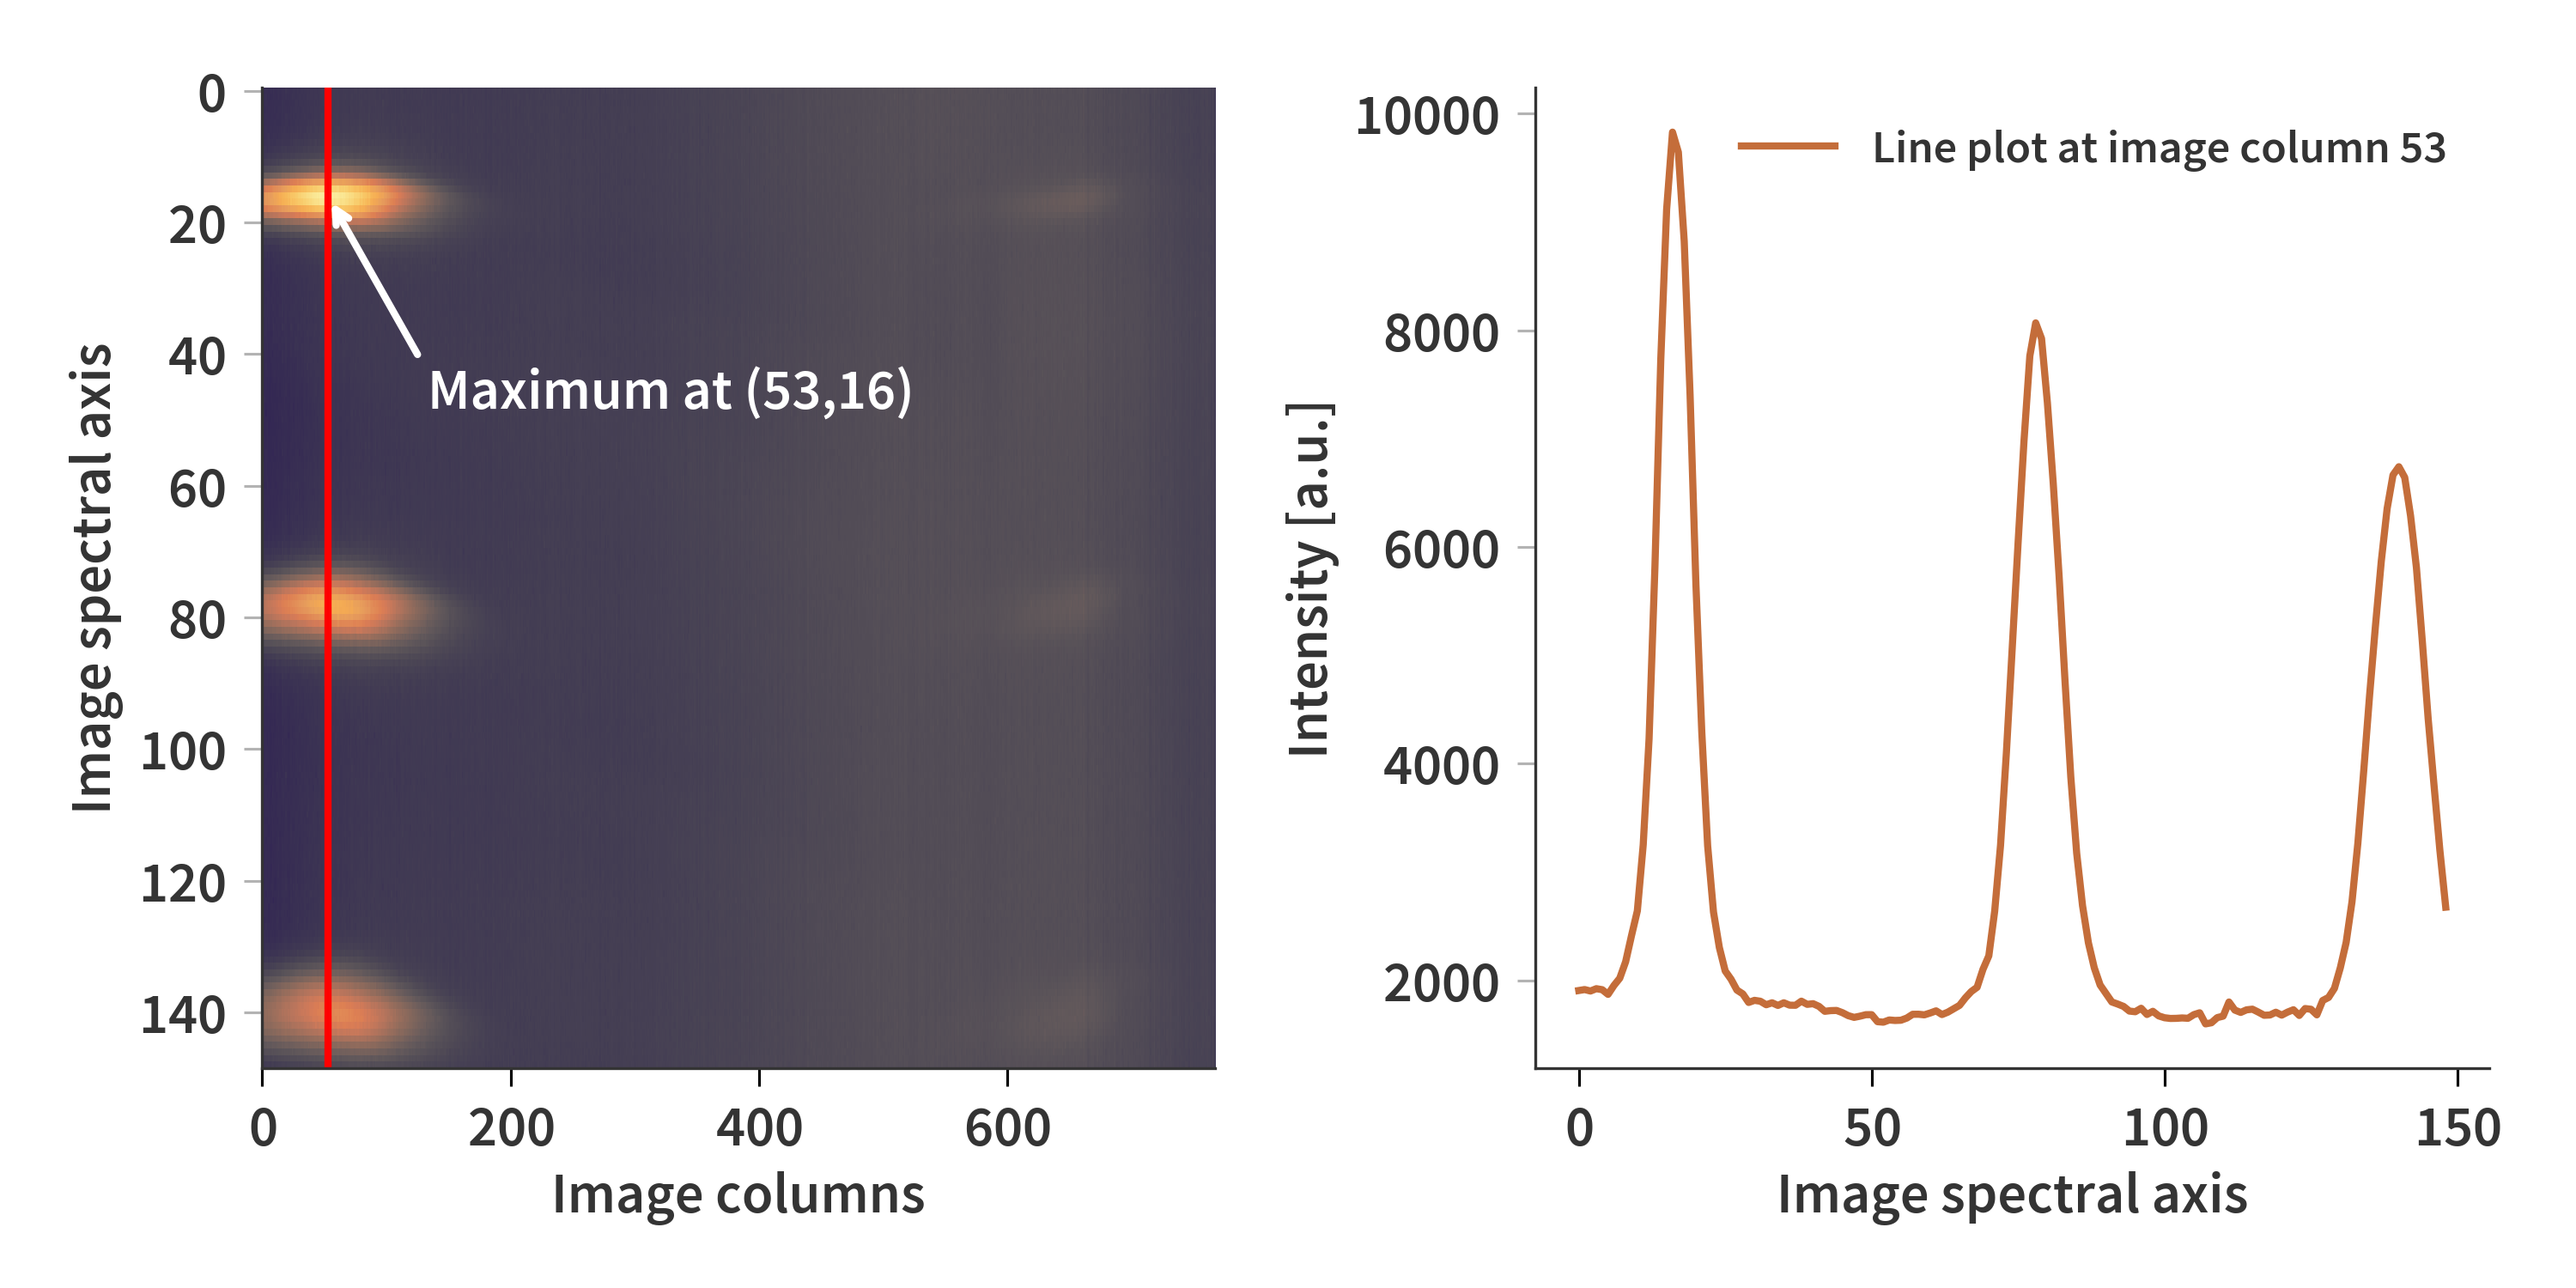
Let’s start by looking at a single transmission filter with a central wavelength at 8.226 µm. At a given mirror separation, the image looks as depicted in Fig. 1. The line plot across all (wavelengths) is also shown.

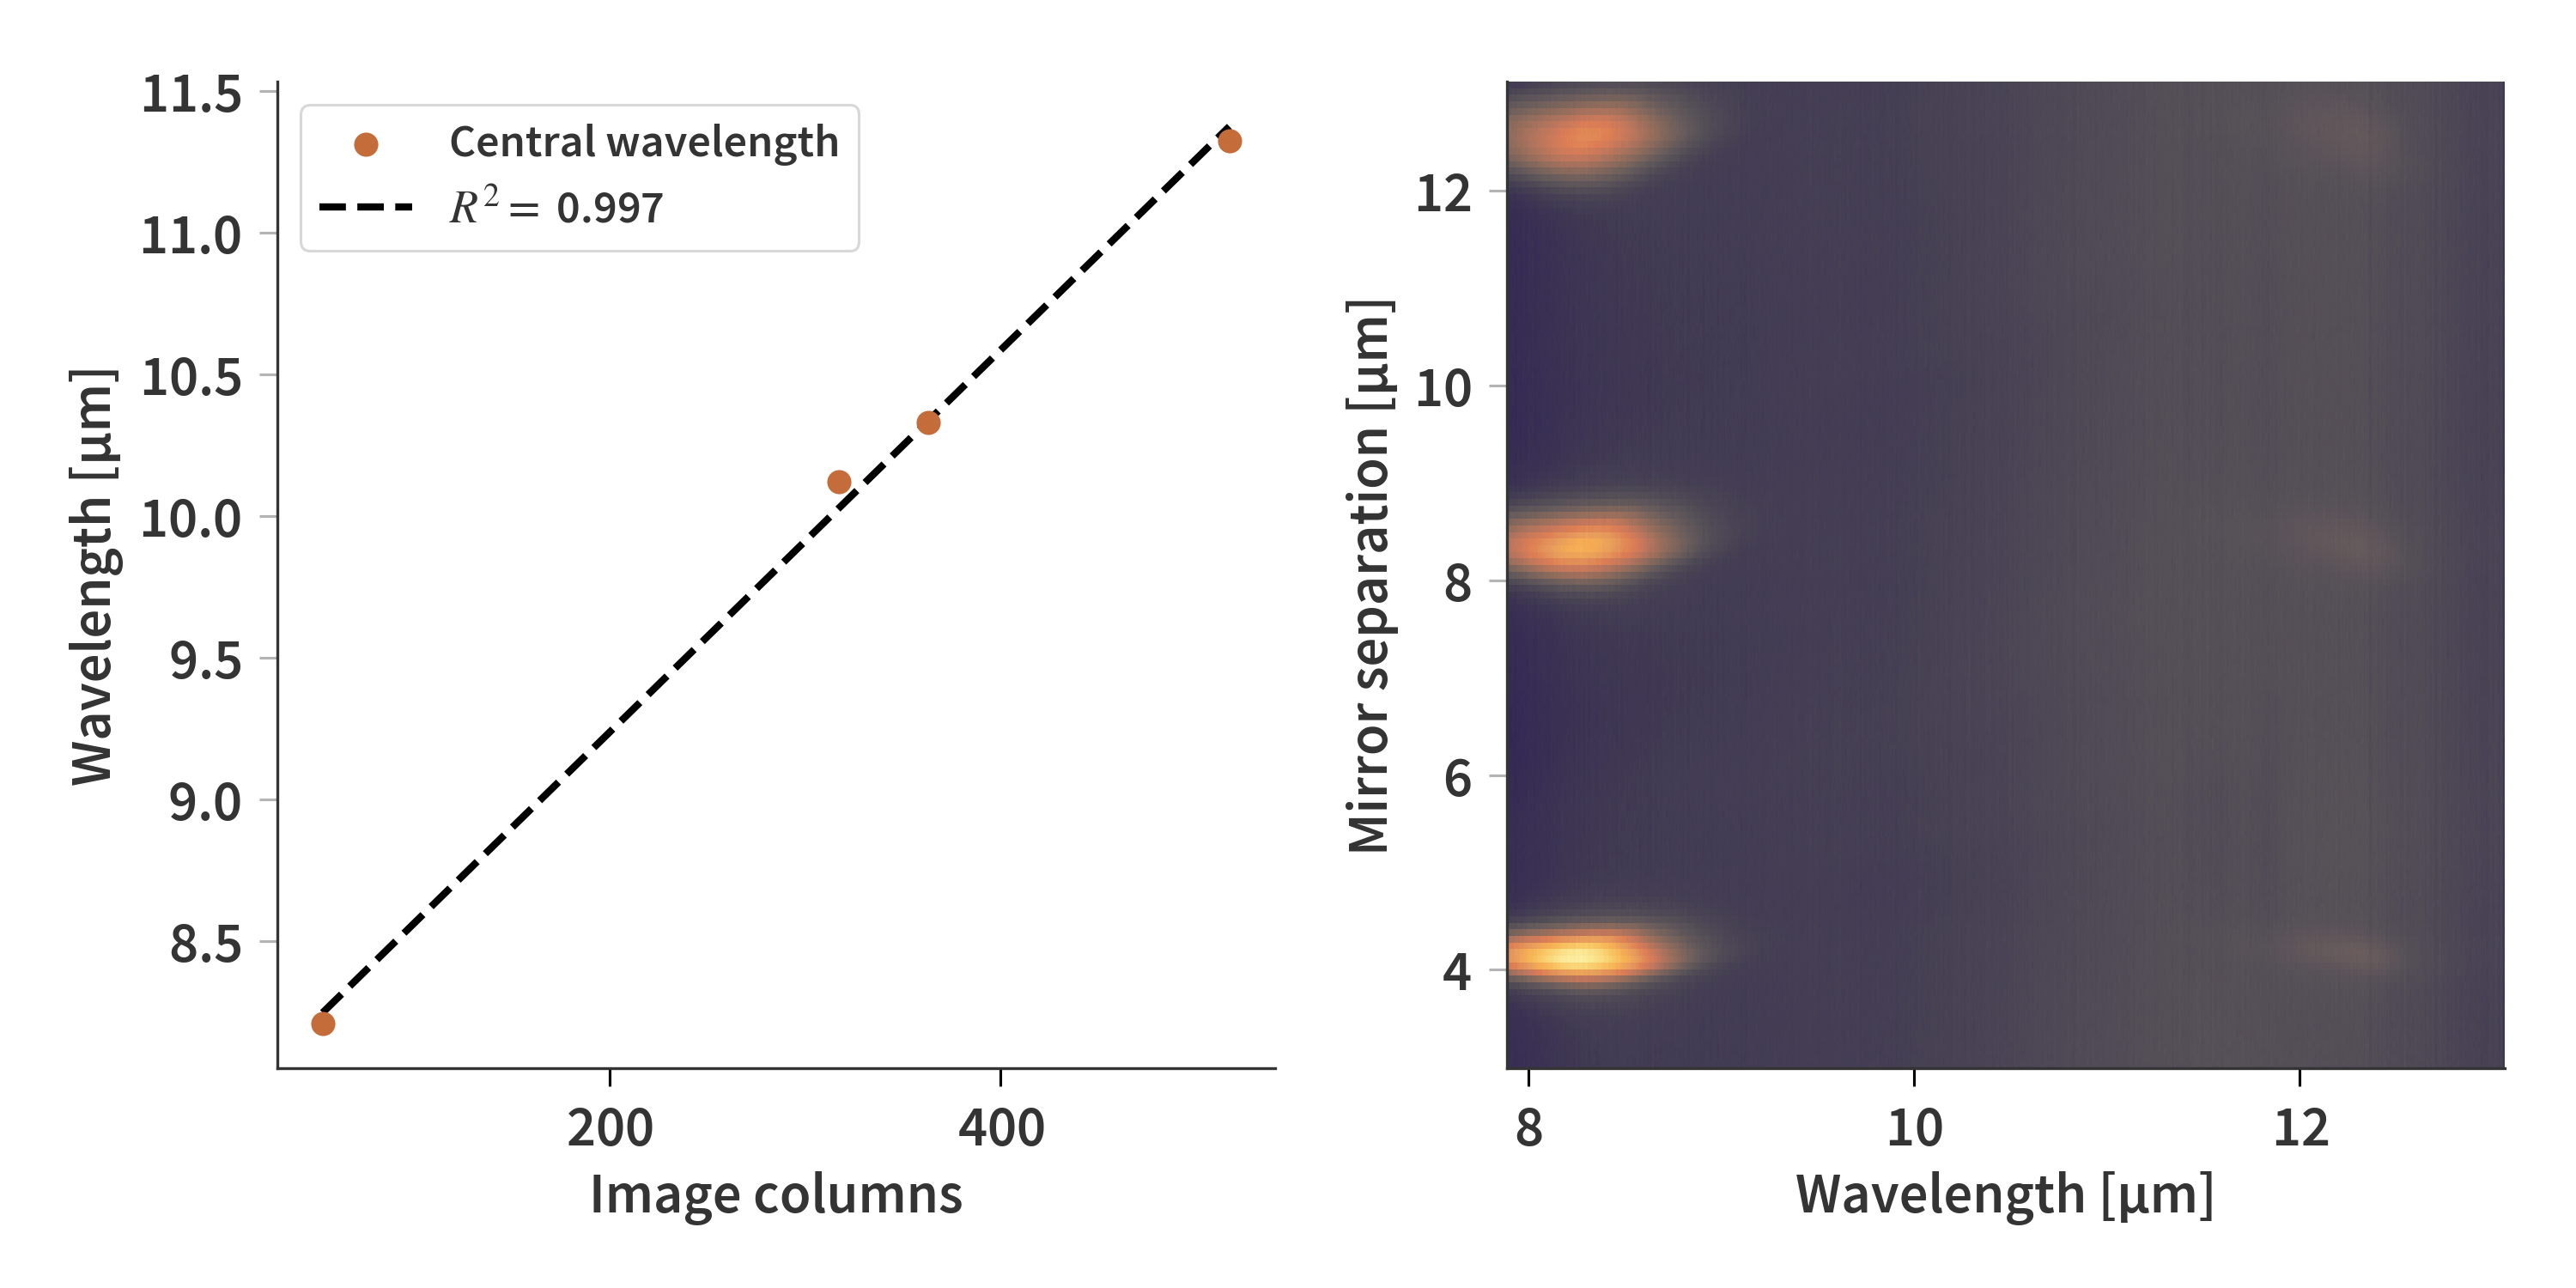
We need to find the location of the maximum to find out where along the column the transmission wavelength lies. This is done by “cutting” the hyperspectral cube along its spectral axis. This means that now, each row corresponds to a given mirror separation - the columns still refer to the wavelengths which we are trying to fit. This is illustrated in Fig. 2 and done for the 8.226 µm, 10.040µm, 10.226µm, and the 11.322 µm filters.

The correlation between the peak transmission wavelength and the column index can be described by a straight line as depicted in Fig. 3. It is then possible to assign correct axes to the rows and columns of the cut plane in Fig. 2. The mirror separation is derived from the interferograms of the laser diodes on the Scanning Fabry-Pérot Interferometer (SFPI). Notice that the cut plane is flipped horizontally. Also, it can here be seen that (unsurprisingly) that the width of the peak along the wavelengths remain constant across transmission orders but the width increases along the mirror separation axis. This is because the peak of the transmission filter is not infinitesimally thin, and therefore the increased resolution cause the peak to spread out.

Looking at more data
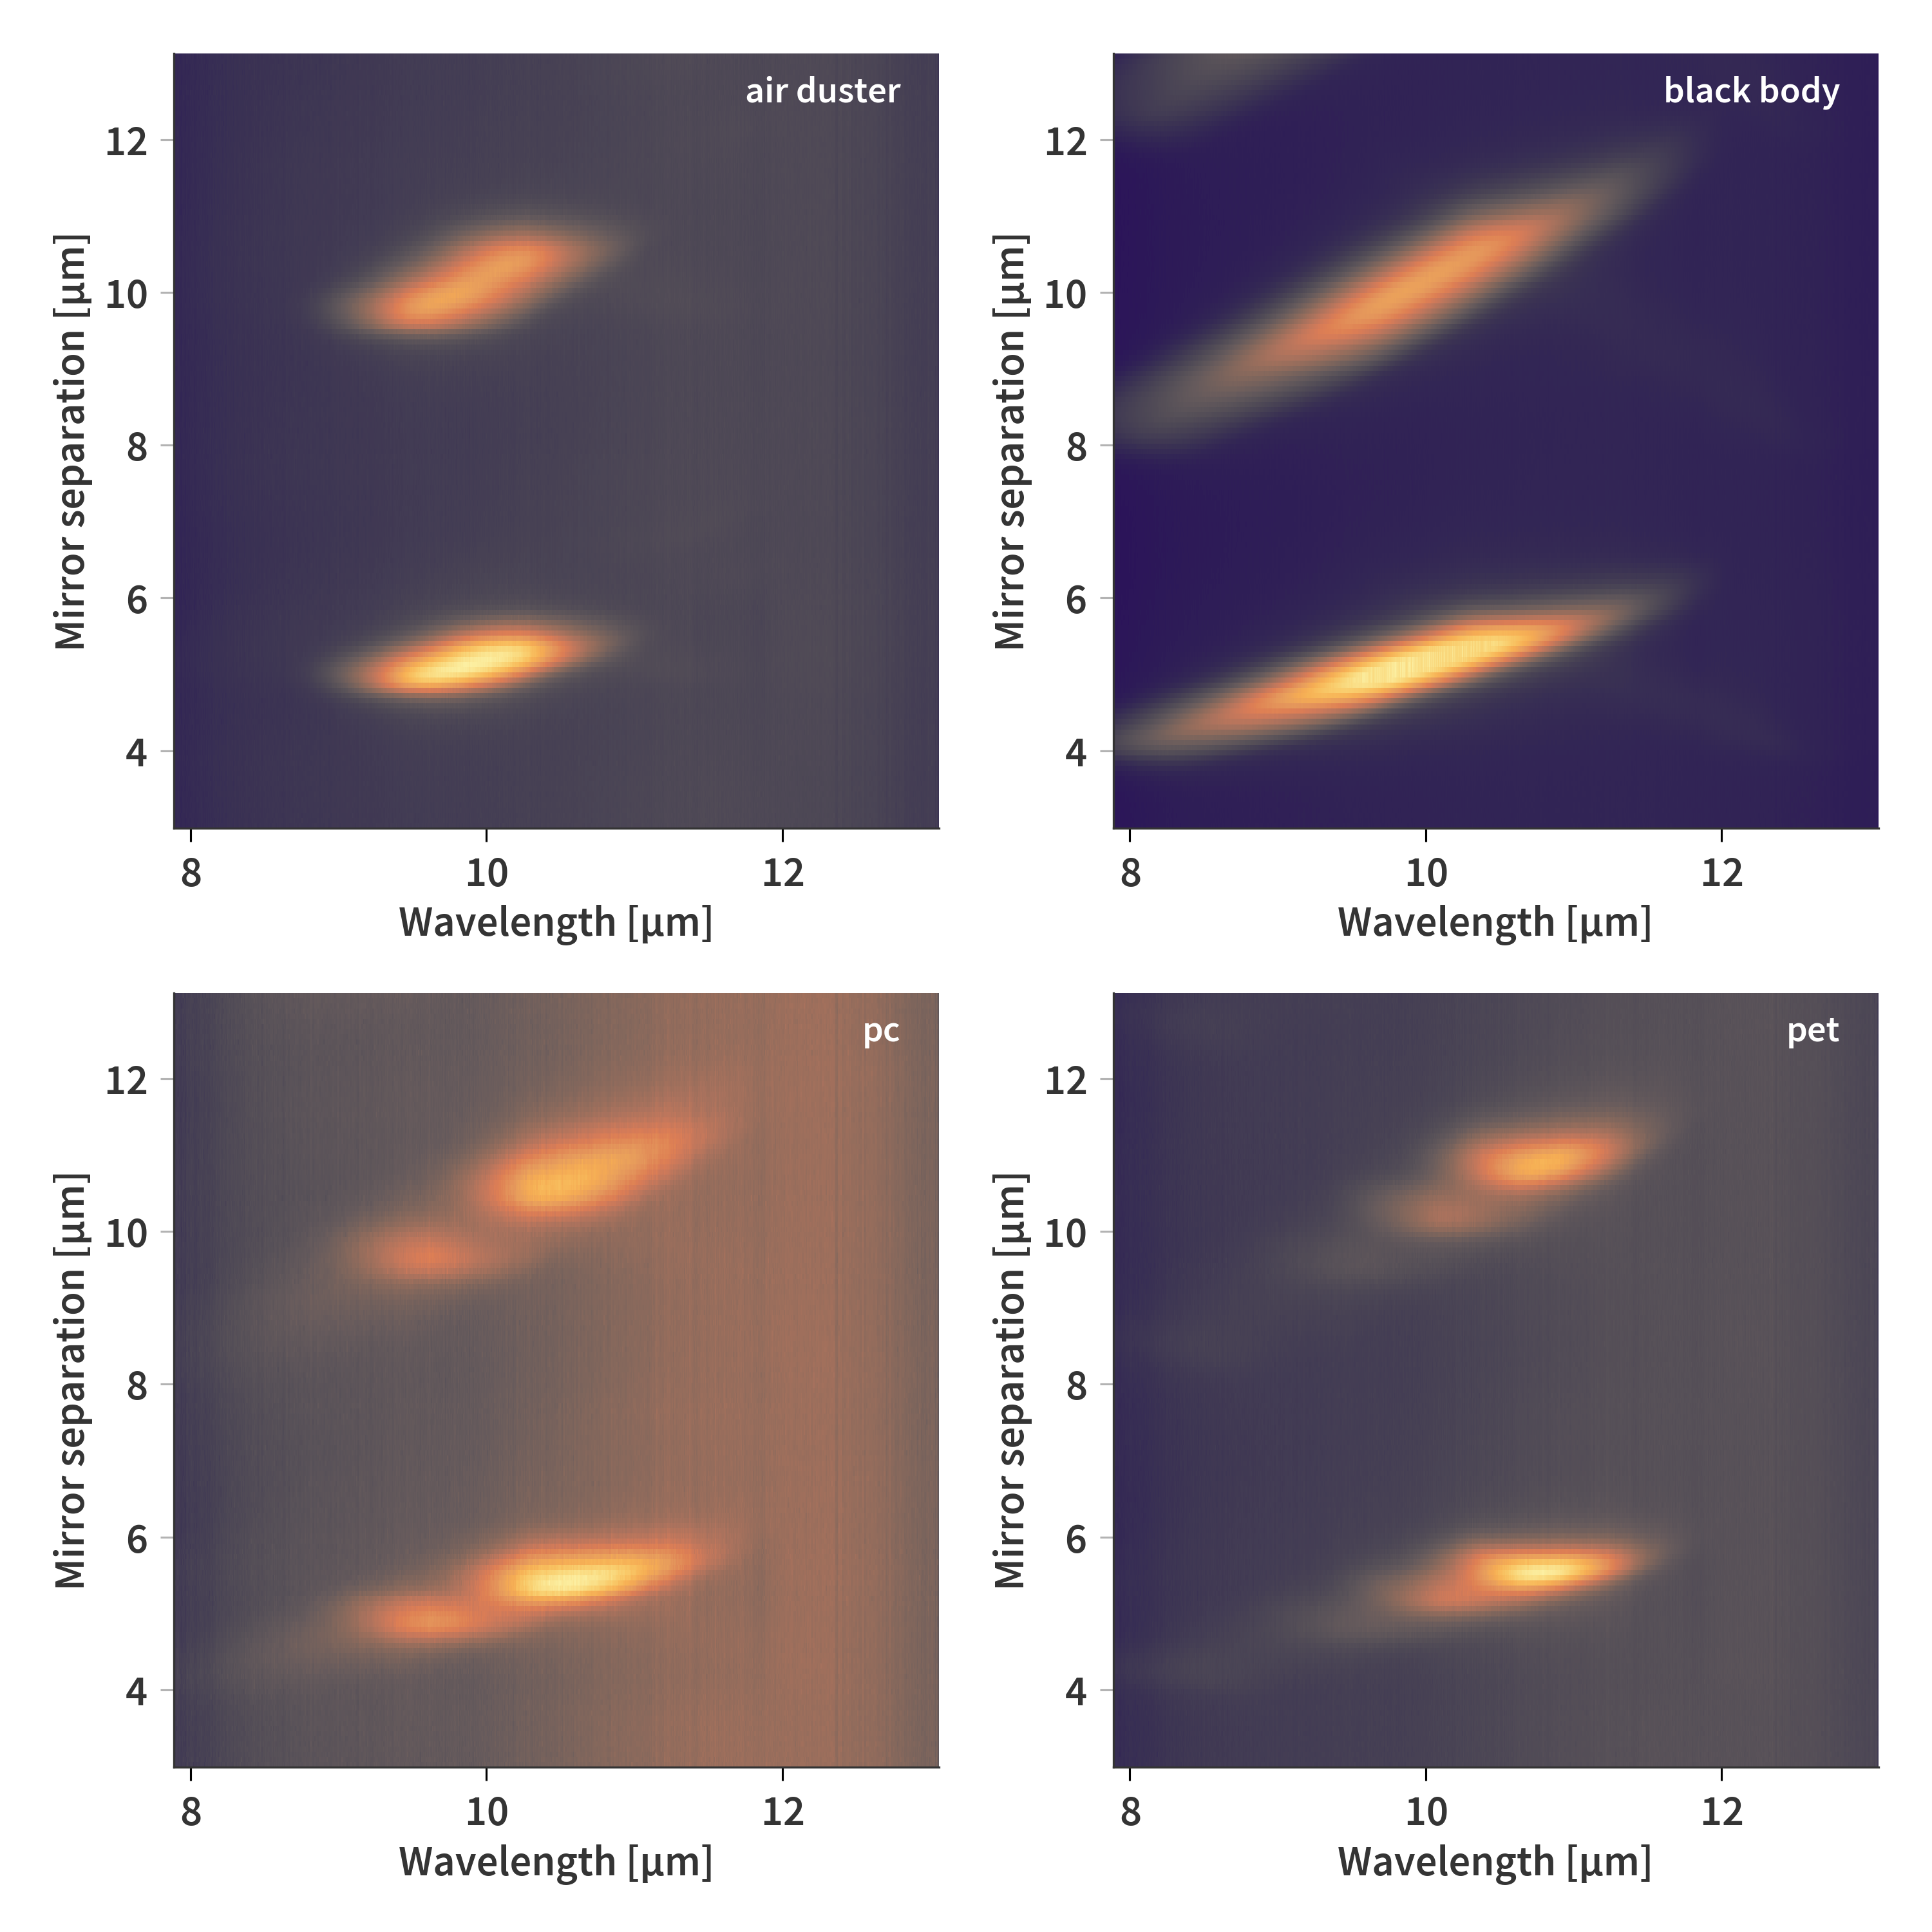
We will now take a look at different samples and see how the wavelengths are separated using this method:

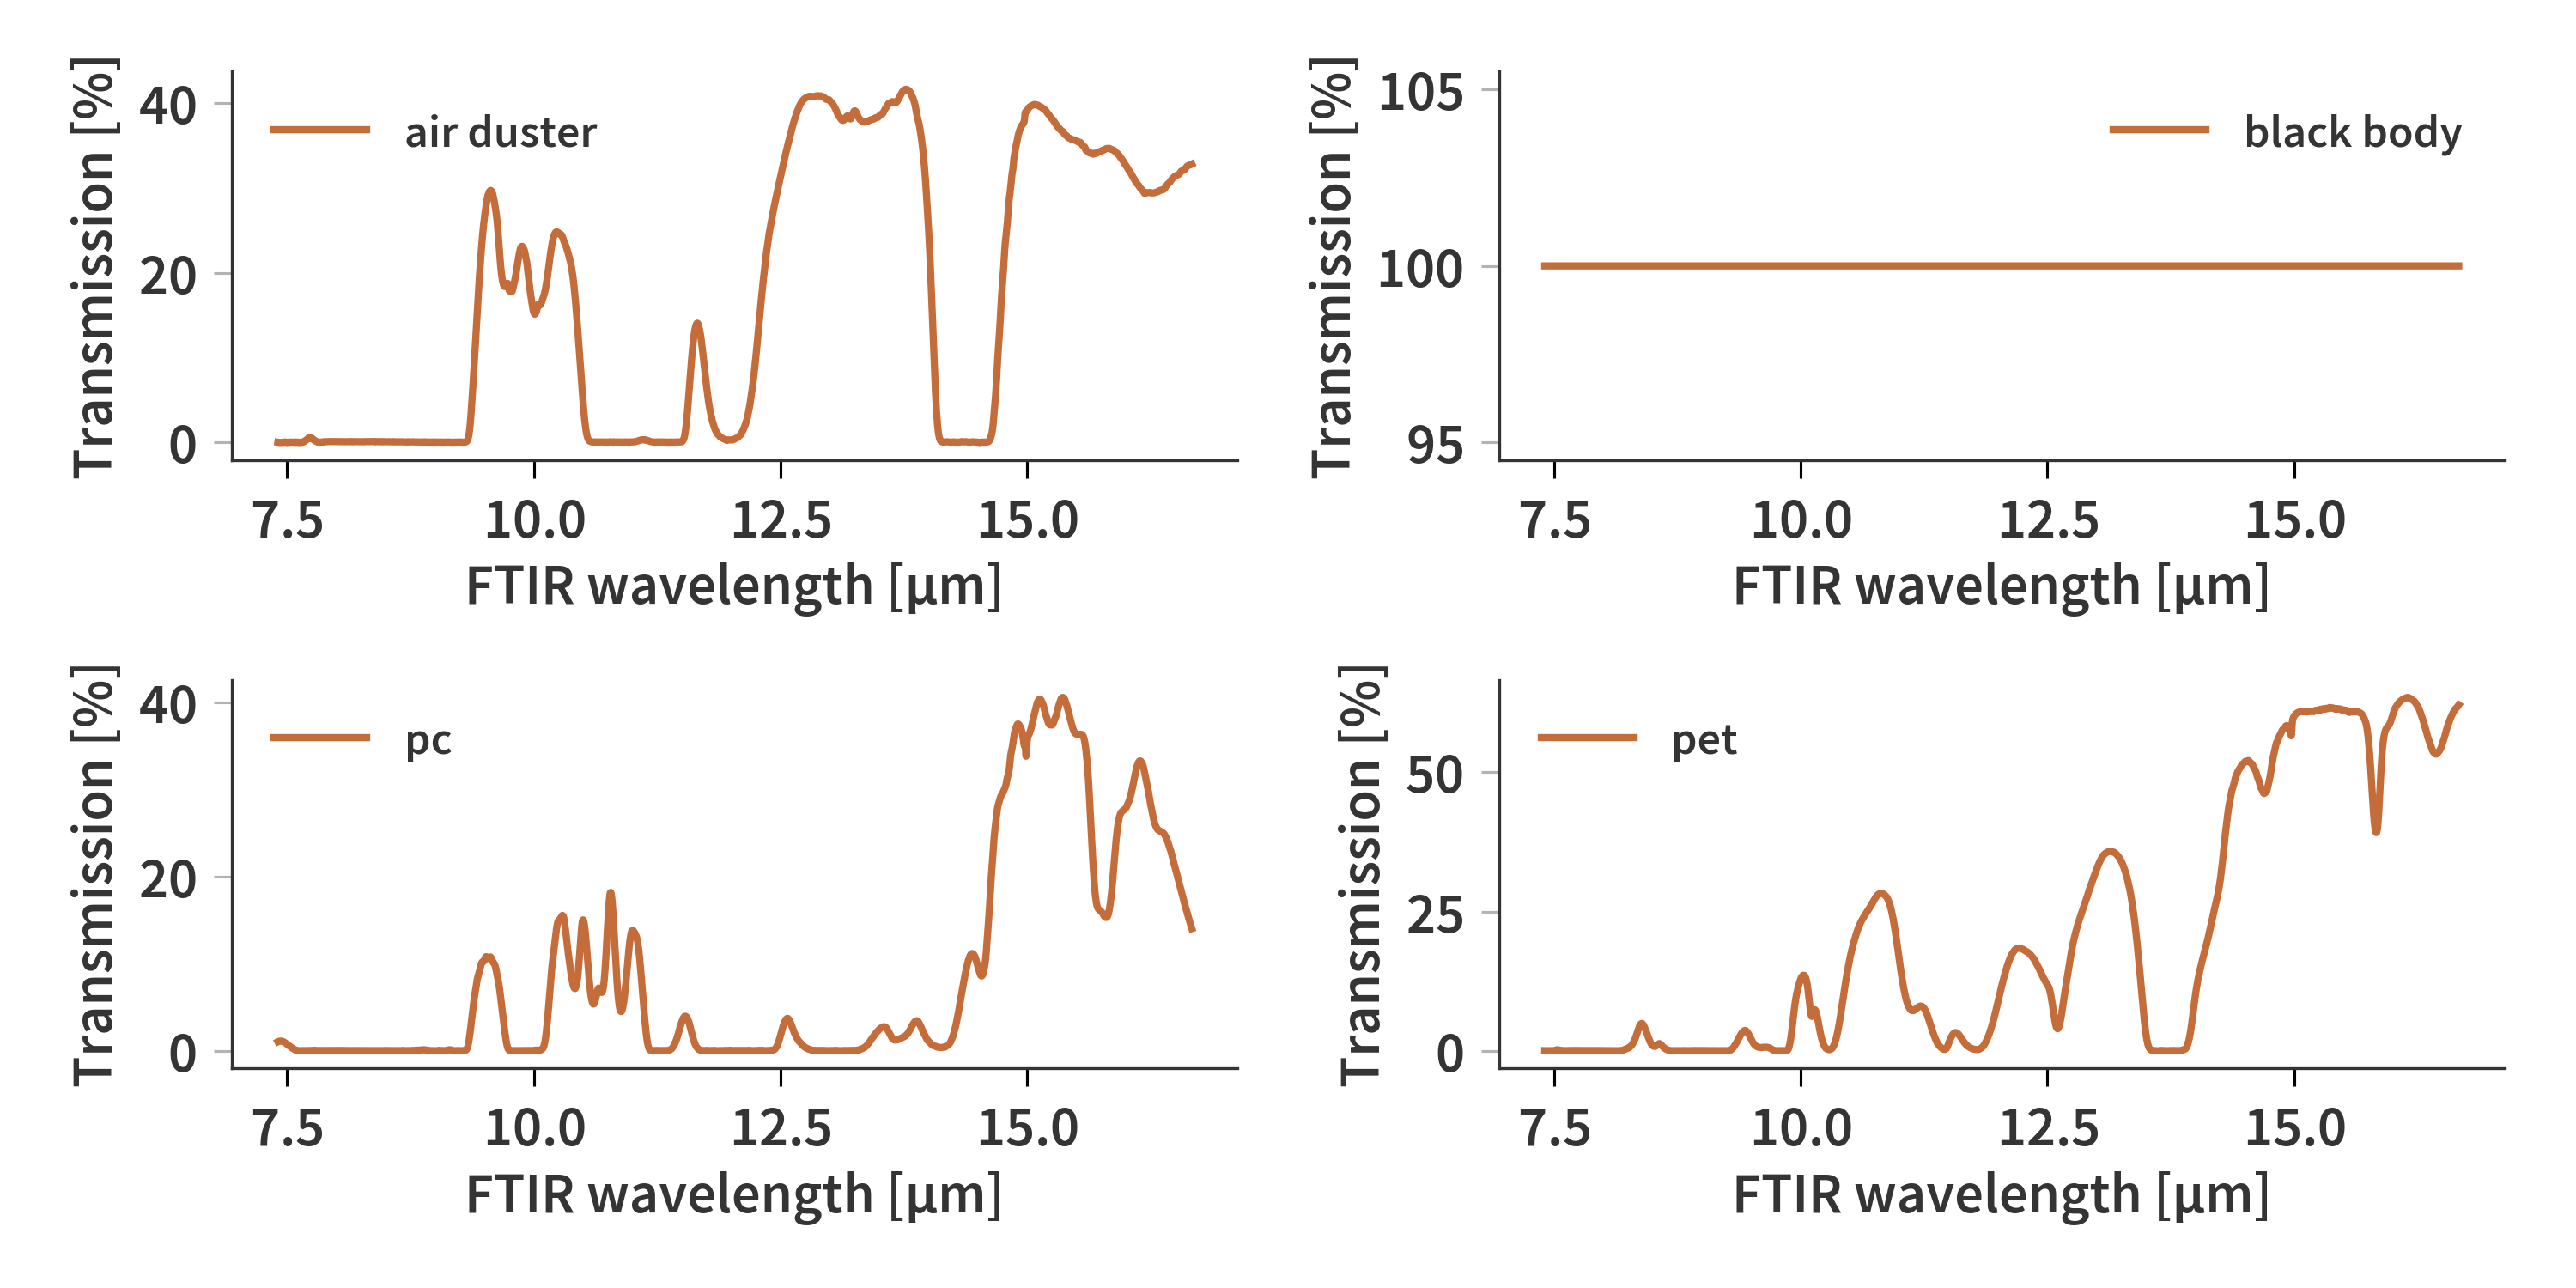
Comparing this to the FTIR transmission measurements in Fig. 5 show why some of the different “splits” occur in Fig. 4. Based on the air duster spectrum we see that the sensitive range only goes up to about 12 µm as only the first transmission peak is captured. Also, the two first transmissions of PC are individually detectable. PET also show to have three distinguishable peaks below 12 µm which are resolved by the SFPI. Finally, the black body measurement resemble the transmission matrix, which has previously been calculated theoretically here. Here we cannot really say anything about the sensitivity of the system since we also must include the efficiency of the grating itself and do not have information about wavelengths above 12 µm.

