How to combine interferograms of different gasses… Theoretically at least
Updated:
What happens if we use the hyperspectral LWIR camera to measure a mixture of gasses? Let’s say that we know the interferograms of the gasses individually, but not their combination. We are only going to work with this theoretically, meaning that we a just going to use a system matrix calculated from TMM and only considering how different FTIR spectra will be recorded into interferograms.
Since the FTIR spectra are measures of transmission, when we have multiple gasses combined, we need to multiply their transmission.
\[\begin{align} \label{eq:ftir_cmb} \mathbf{t} = \mathbf{t}^{(1)}\circ\mathbf{t}^{(2)}\circ... = \prod_{i=1}^{K}\mathbf{t}^{(i)}, \end{align}\]where $K$ is the total number of different transmission spectra. The interferogram which is recorded by the camera is then the dot product of $\mathbf{t}$ and the system matrix $\mathbf{A}$. Let’s constrain ourselves to only have a single gas in the first place.
\[\begin{align} \label{eq:interferogram_single} \mathbf{s}^{(1)} = \mathbf{At} = \begin{bmatrix} a_{1,1}t_1^{(1)} &+& a_{1,2}t_2^{(1)} &+& \dots &+& a_{1,N}t_N^{(1)} \\ a_{2,1}t_1^{(1)} &+& a_{2,2}t_2^{(1)} &+& \dots &+& a_{2,N}t_N^{(1)}\\ \vdots & & \vdots & & \dots & & \vdots\\ a_{M,1}t_1^{(1)} &+& a_{M,2}t_2^{(1)} &+& \dots &+& a_{M,N}t_N^{(1)}\\ \end{bmatrix} \end{align}\]Let’s now see what happens if we add two additional gasses. The combined interferogram then becomes
\[\begin{align} \label{eq:interferogram_multi_spec} \mathbf{s_{cmb}} = \mathbf{At} = \begin{bmatrix} a_{1,1}t_1^{(1)}t_1^{(2)}t_1^{(3)} &+& a_{1,2}t_2^{(1)}t_2^{(2)}t_2^{(3)} &+& \dots &+& a_{1,N}t_N^{(1)}t_N^{(2)}t_N^{(3)} \\ a_{2,1}t_1^{(1)}t_1^{(2)}t_1^{(3)} &+& a_{2,2}t_2^{(1)}t_2^{(2)}t_2^{(3)} &+& \dots &+& a_{2,N}t_N^{(1)}t_N^{(2)}t_N^{(3)}\\ \vdots & & \vdots & & \dots & & \vdots\\ a_{M,1}t_1^{(1)}t_1^{(2)}t_1^{(3)} &+& a_{M,2}t_2^{(1)}t_2^{(2)}t_2^{(3)} &+& \dots &+& a_{M,N}t_N^{(1)}t_N^{(2)}t_N^{(3)}\\ \end{bmatrix} \end{align}\]There does not seem to be an easy method of combining individual interferograms, $\mathbf{s}^{(1)}$, $\mathbf{s}^{(2)}$, and $\mathbf{s}^{(3)}$ to arrive at $\mathbf{s_{cmb}}$. It is therefore not possible to mix two or more interferograms to estimate the result of combining gasses (at least not linearly).
What happens if the concentration changes for a single gas?
We’re going to go a bit further. What happens to the transmission if the concentration of the gas changes? From Lambert Beer’s law, we know that the absorbance can be calculated as
\[\begin{align} \label{eq:Lambert_beer} A = \alpha d c \end{align}\]$\alpha$ is the extinction coefficient $[\textrm{L}\cdot\textrm{mol}^{-1}\cdot\textrm{cm}^{-1}]$, $d$ is the pathlenght, and $c$ is the concentration. In many of the experiments we have performed the gases have been in the same gas cell, and therefore the only parameter that changes for each gas is its concentration. The transmission can then be calculated as
\[\begin{align} \label{eq:transmission} t = 10^{-A} \Rightarrow A = - \textrm{log}_{10}(t) \end{align}\]This off course can be expanded to be applicable for an entire spectrum. We therefore see, that a linear change in $c$ does not result in a linear change in $t$ and therefore not a linear change in $\mathbf{s}$ either.
But can’t we just try converting $\mathbf{s}$ to absorbance? That would look something like this:
\[\begin{align} \label{eq:interferogram_single_log10} \textrm{log}_{10}\left(\mathbf{s}^{(1)}\right) = \begin{bmatrix} \textrm{log}_{10}(a_{1,1}t_1^{(1)} &+& a_{1,2}t_2^{(1)} &+& \dots &+& a_{1,N}t_N^{(1)}) \\ \textrm{log}_{10}(a_{2,1}t_1^{(1)} &+& a_{2,2}t_2^{(1)} &+& \dots &+& a_{2,N}t_N^{(1)})\\ \vdots & & \vdots & & \dots & & \vdots\\ \textrm{log}_{10}(a_{M,1}t_1^{(1)} &+& a_{M,2}t_2^{(1)} &+& \dots &+& a_{M,N}t_N^{(1)})\\ \end{bmatrix} \end{align}\]The minus sign is omitted since we no longer work in absolute transmission and all values usually are above 1. This might help the interpretation later, but I have a hard time seeing whether this would even work, so let’s try with some data.
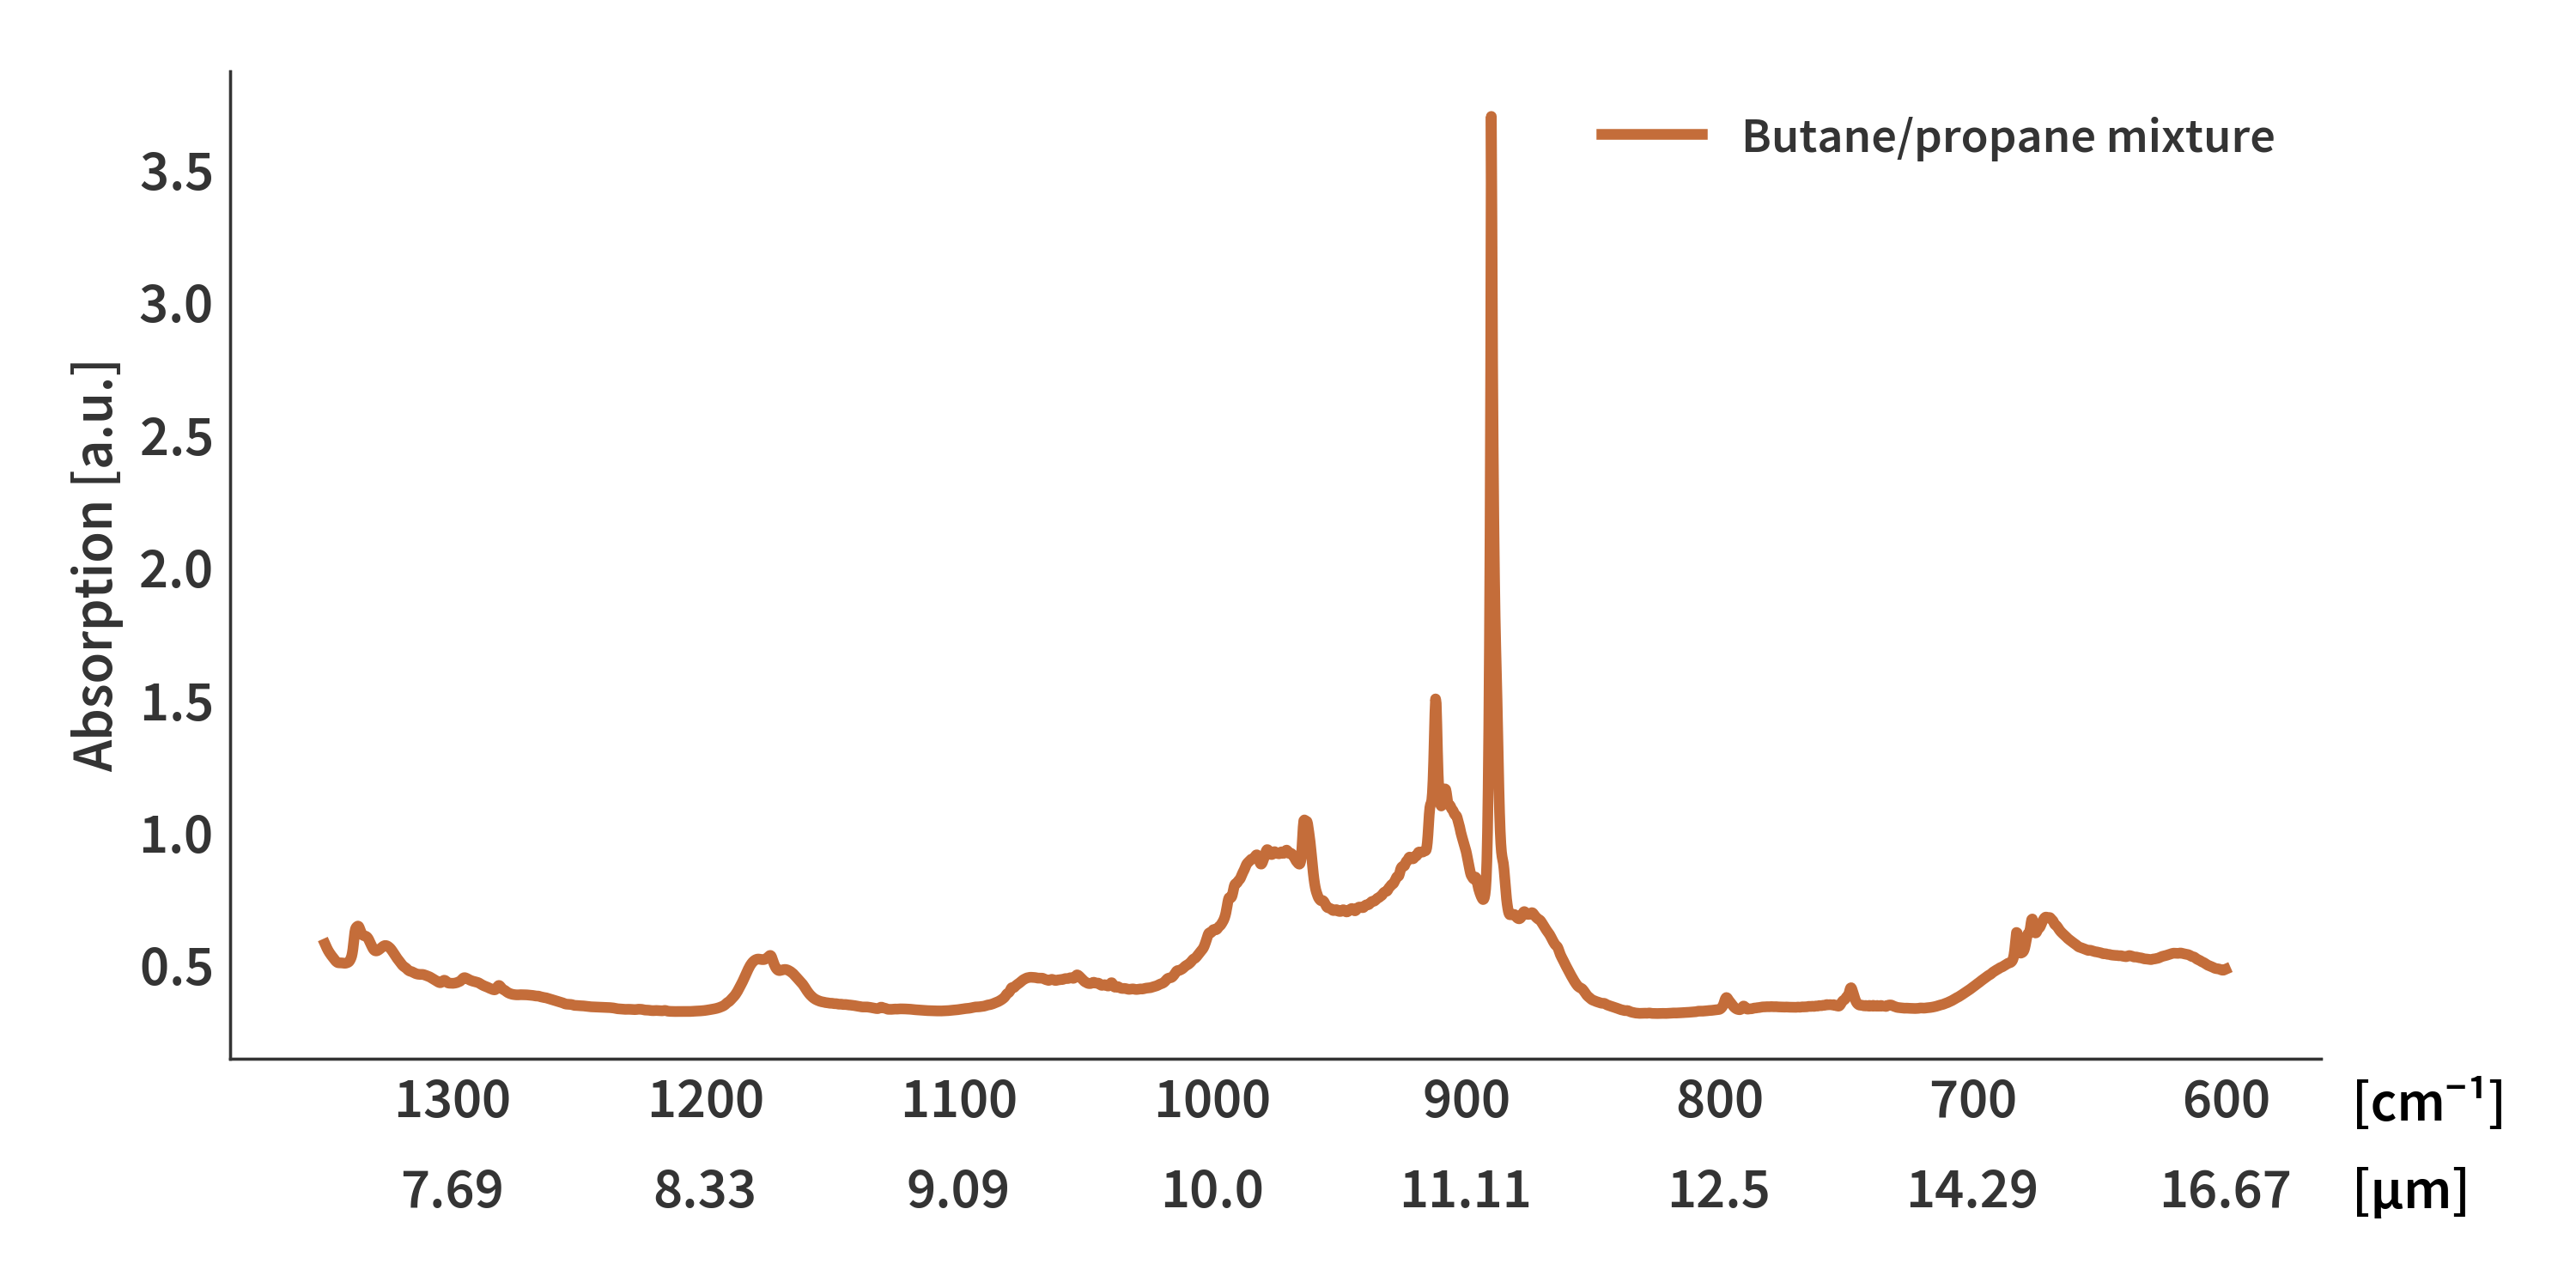
Let’s convert the recorded FTIR transmission spectrum to absorption using Eq. \ref{eq:transmission} (Fig. 1)

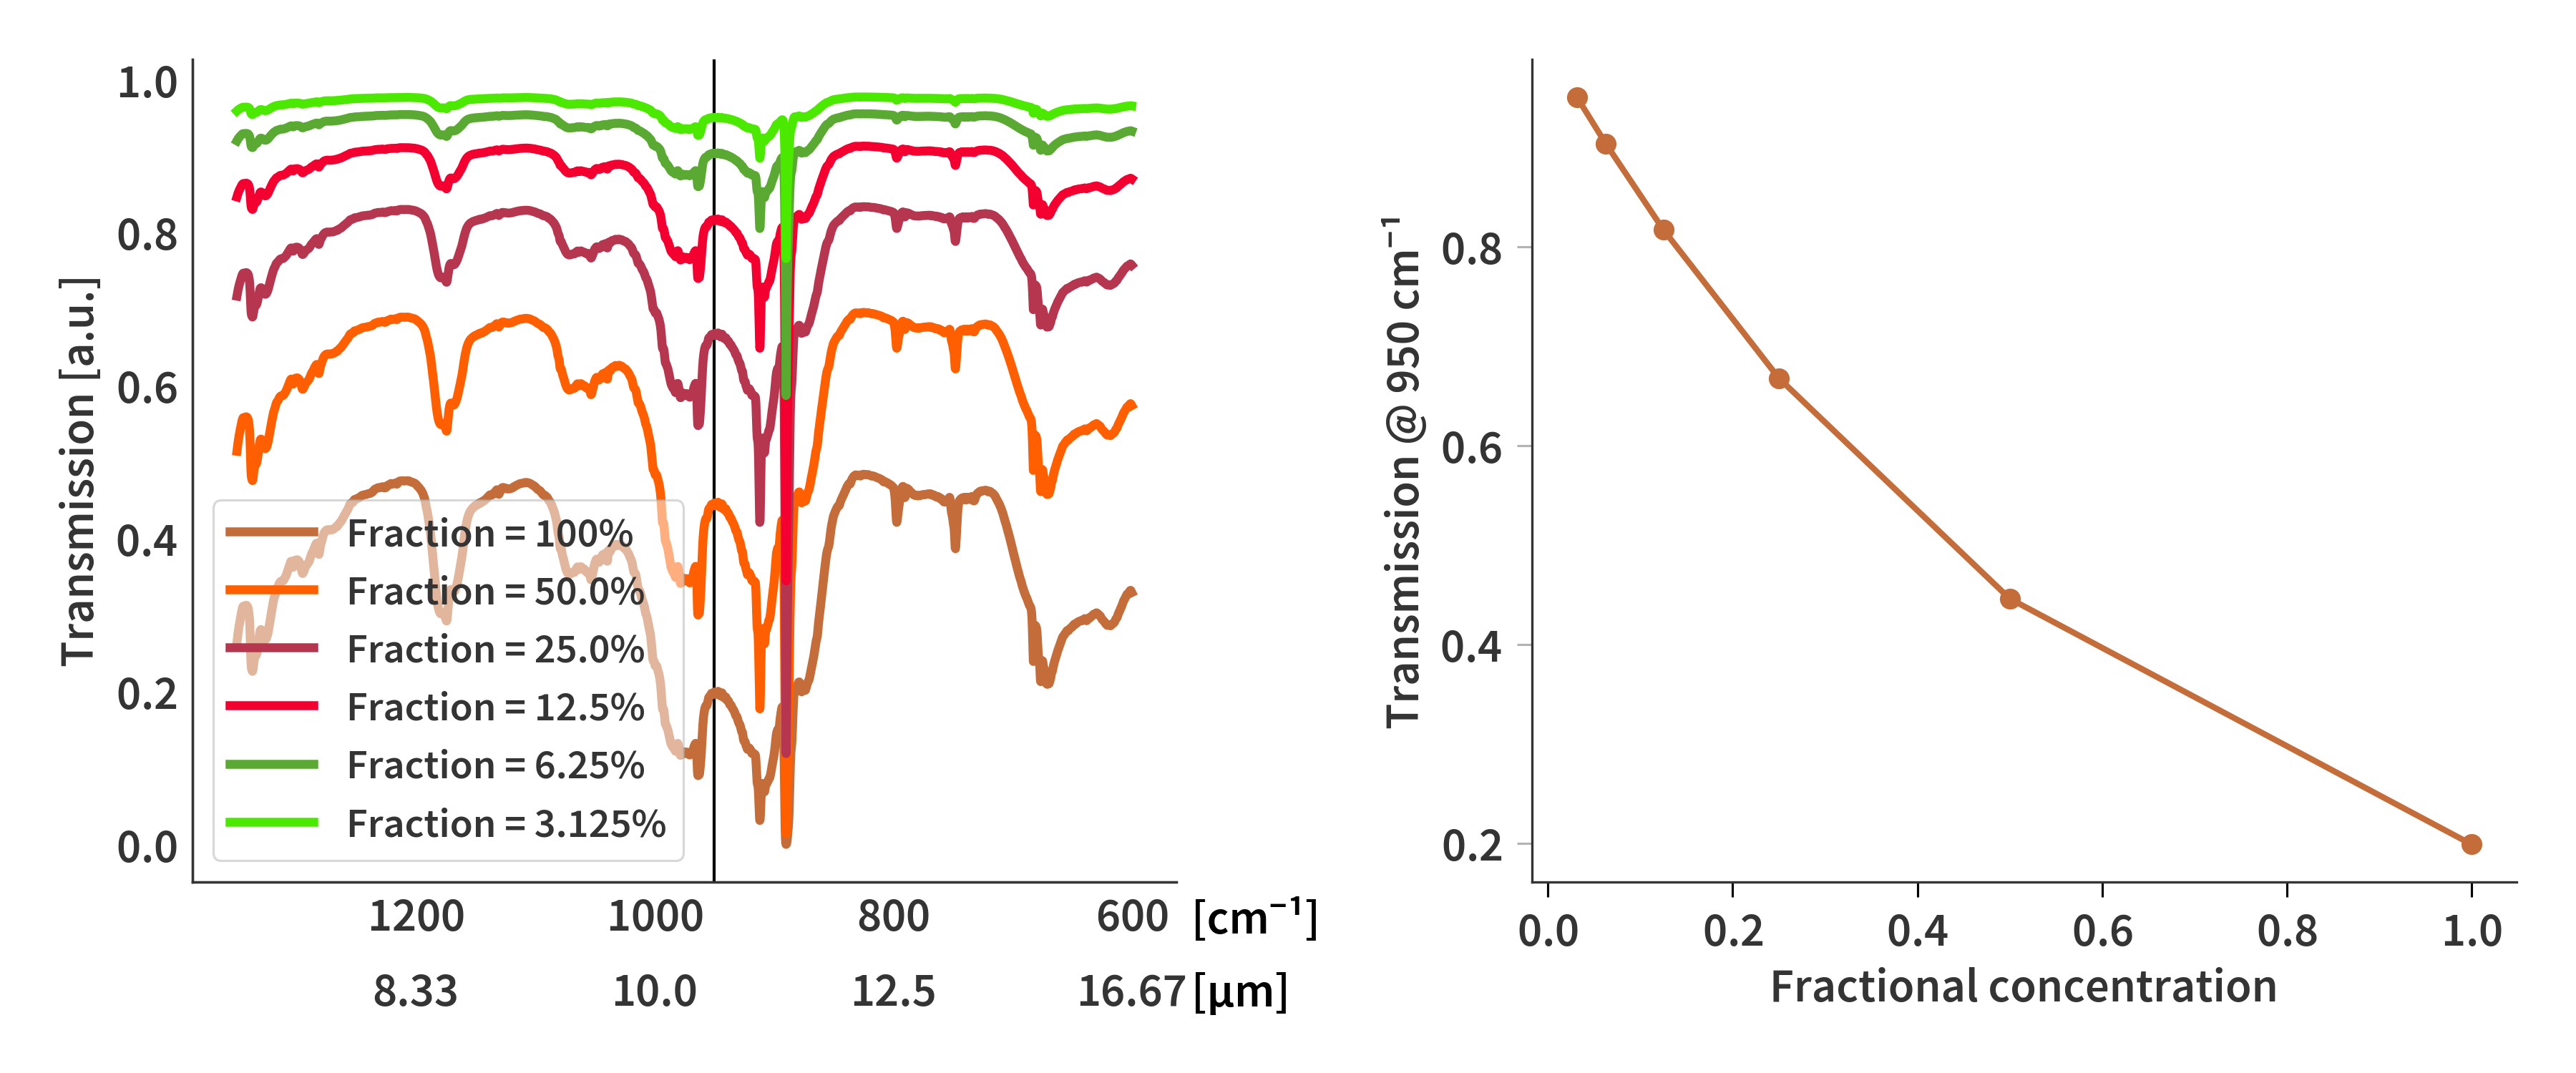
This will serve as the ‘reference concentration’. Since the absorption is linearly proportional to the concentration, it is possible to emulate other concentrations simply by scaling. After scaling the corresponding transmission spectra can then be calculated again based in Eq. \ref{eq:transmission}. This is done for a number of different concentrations and the results are presented in Fig. 2. The intensity at a single band (950 cm-1) is plotted as a function of the fractional concentrations. Notice here how the relationship is not linear - as expected.

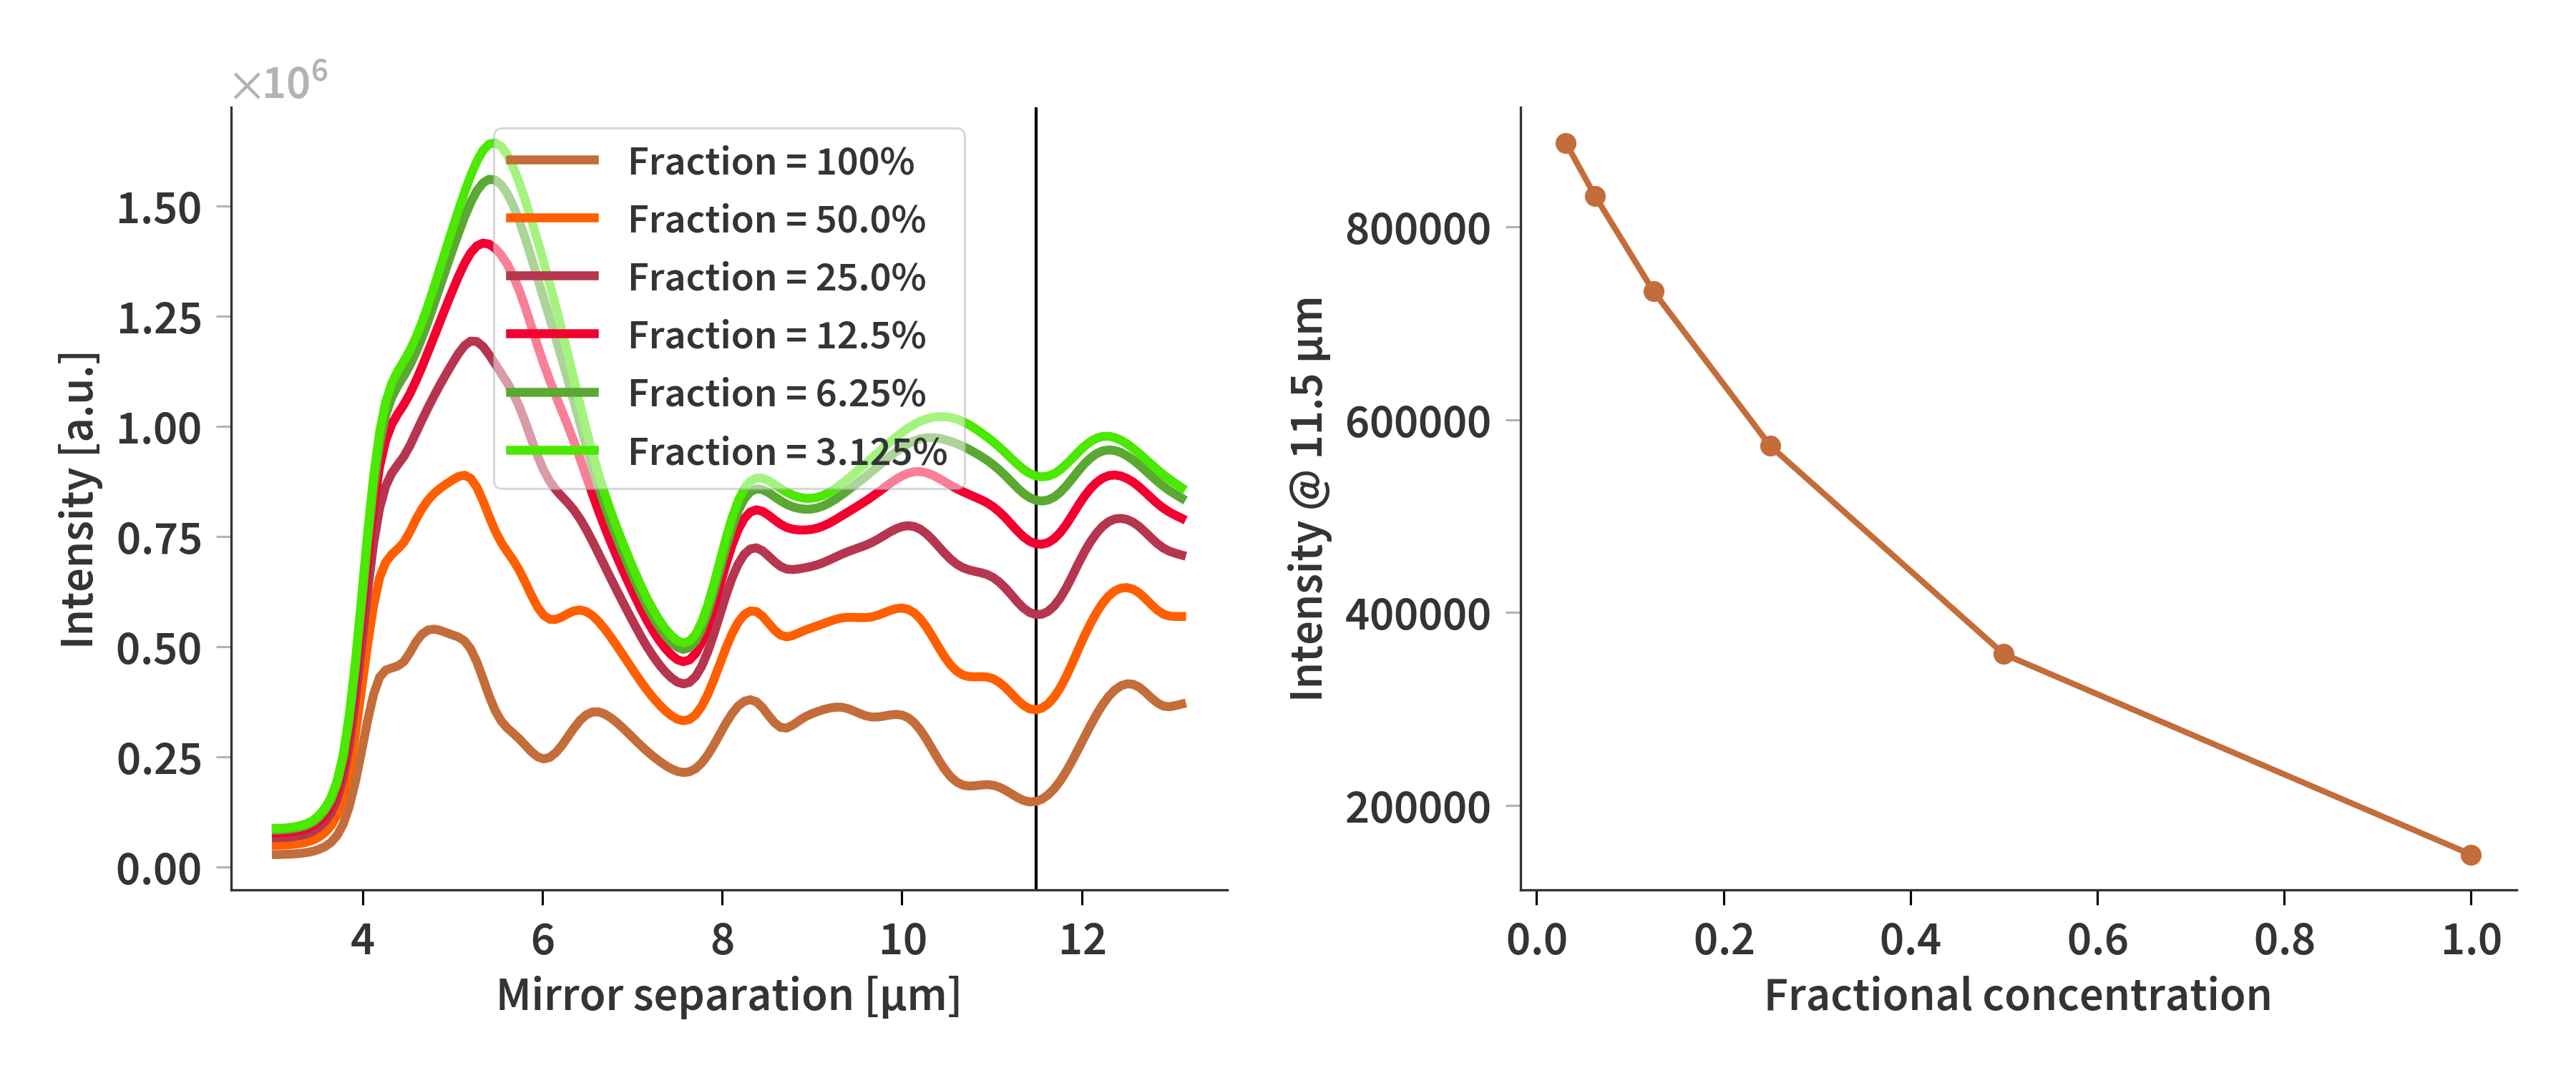
How do the different transmission spectra then map to the interferograms recorded by the camera? Fig 3. illustrates how the intensity at a single band (11.5 µm mirror separation) is changing as a function of concentration and it is concluded that it follows the same trend as for the FTIR transmission spectra.

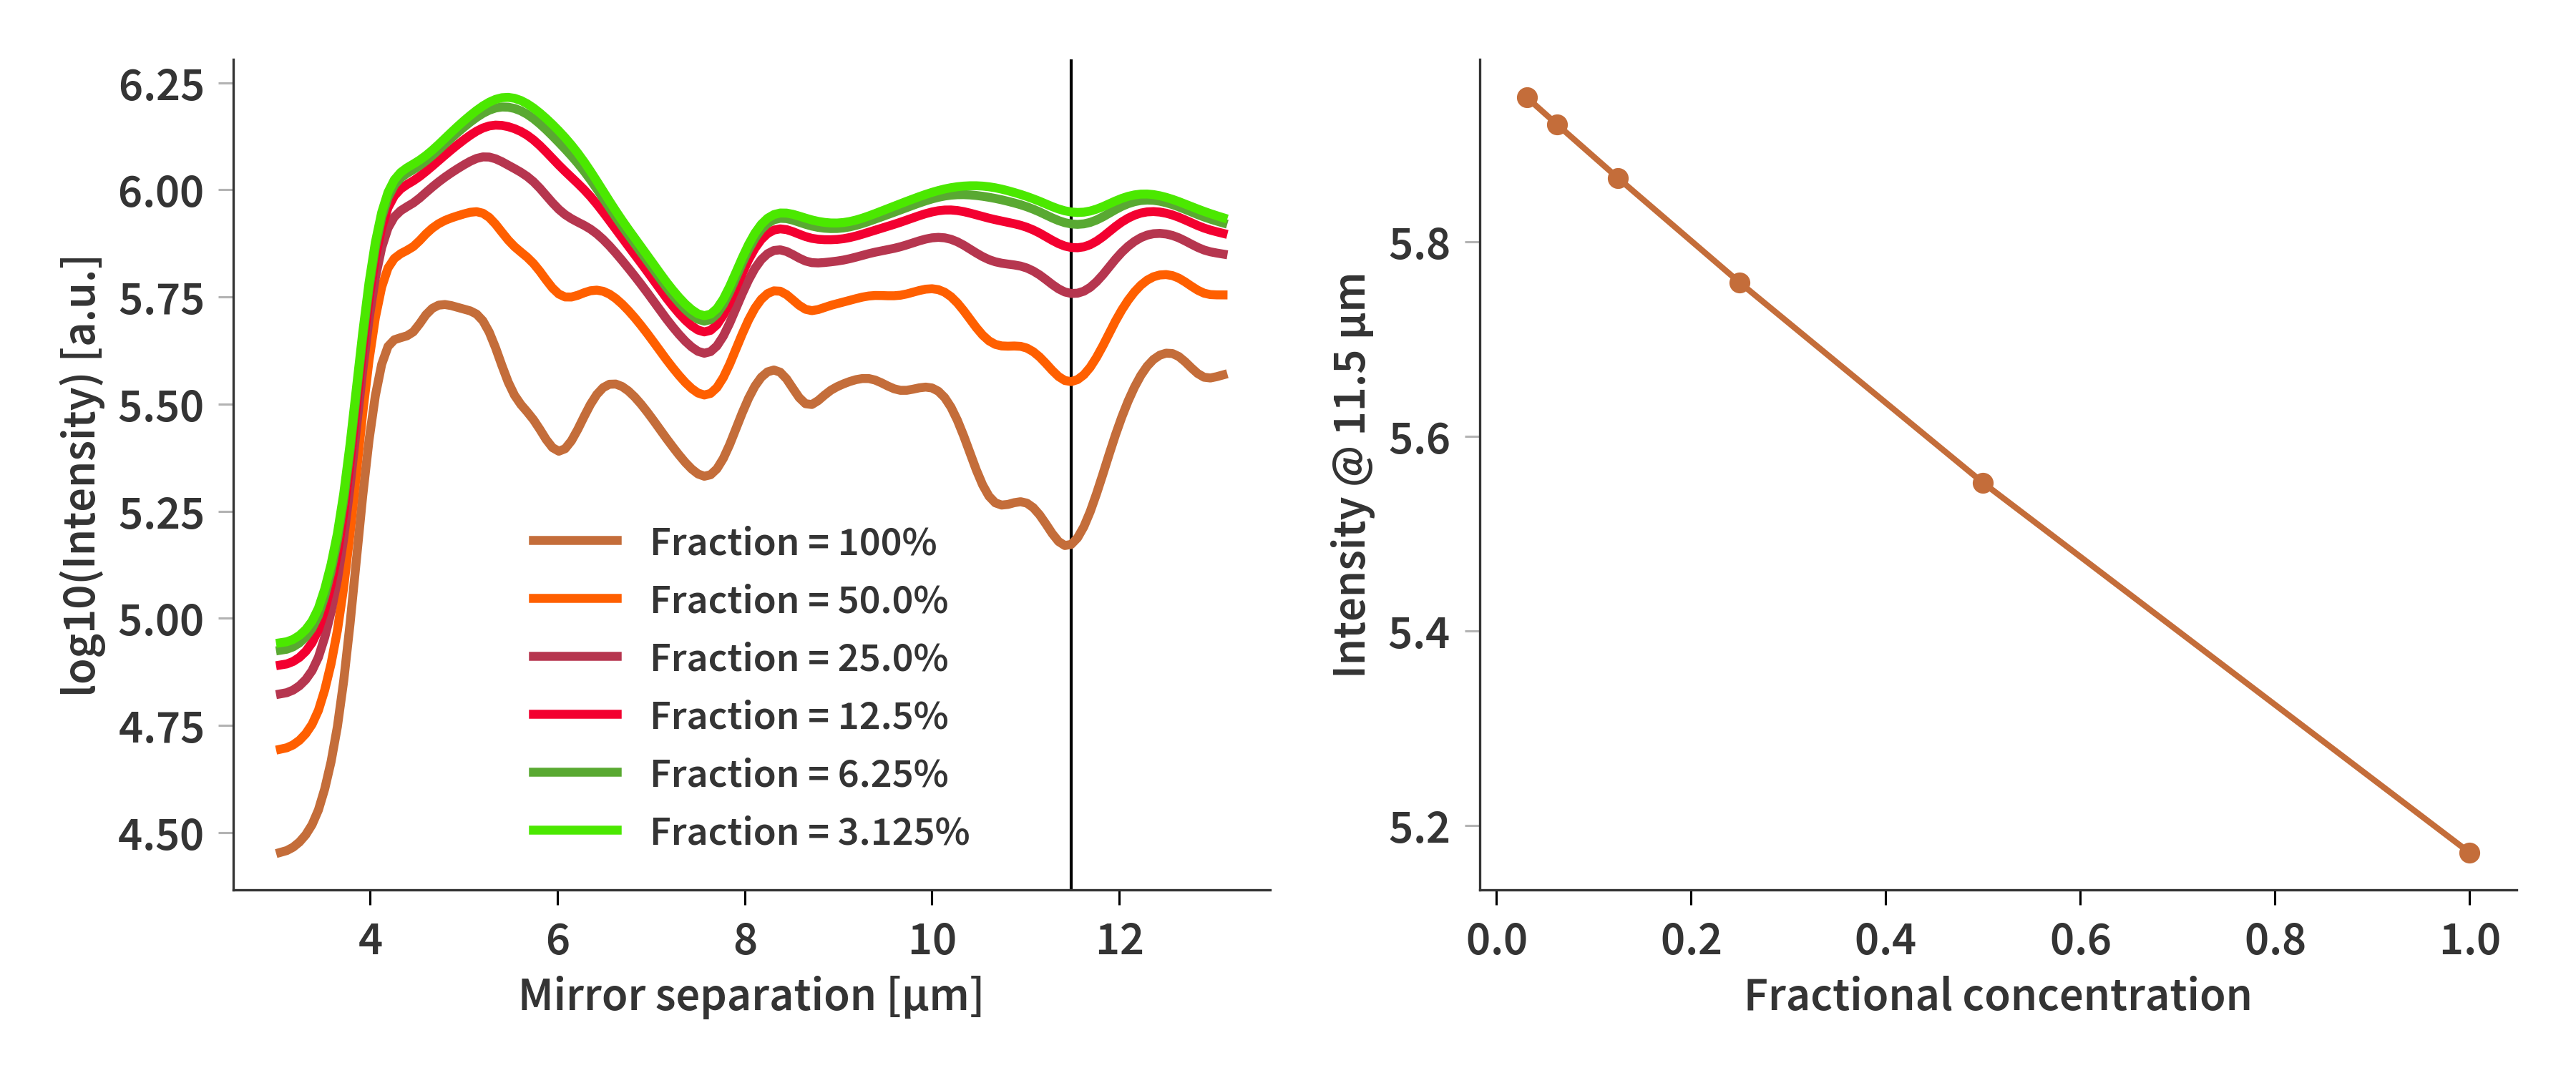
Finally, we see how the intensity changes with concentration as the interferograms are converted by taking their logarithm. We see now that the relationship between the intensity at a given band and the concentration now is linear (Fig. 4).

